This topic describes the Insights Anomaly detection product.
Unexpected cost spikes and the overwhelming complexity of managing cloud environments make it difficult to detect and address cloud spend anomalies effectively.
Using the Insights Anomaly detection feature, you can identify rare cost occurrences and usage patterns in AWS environments that deviate from the expected minimum and maximum range.
You can also set custom alert thresholds to proactively catch unusual resource activities before they escalate into larger cost issues.
Insights Anomaly detection uses the CUR to monitor all AWS usage metrics daily, detecting anomalies by account, region, and service.
For best reporting, ensure that your CUR has a minimum of 60 days of cost history.
You can manage anomalies in the Insights > Anomaly Detection page tabs:
Active anomalies: shows anomalies that are currently active
Archived anomalies: shows anomalies that are no longer active
Alerts setup: set up anomaly alerts
Active anomalies tab
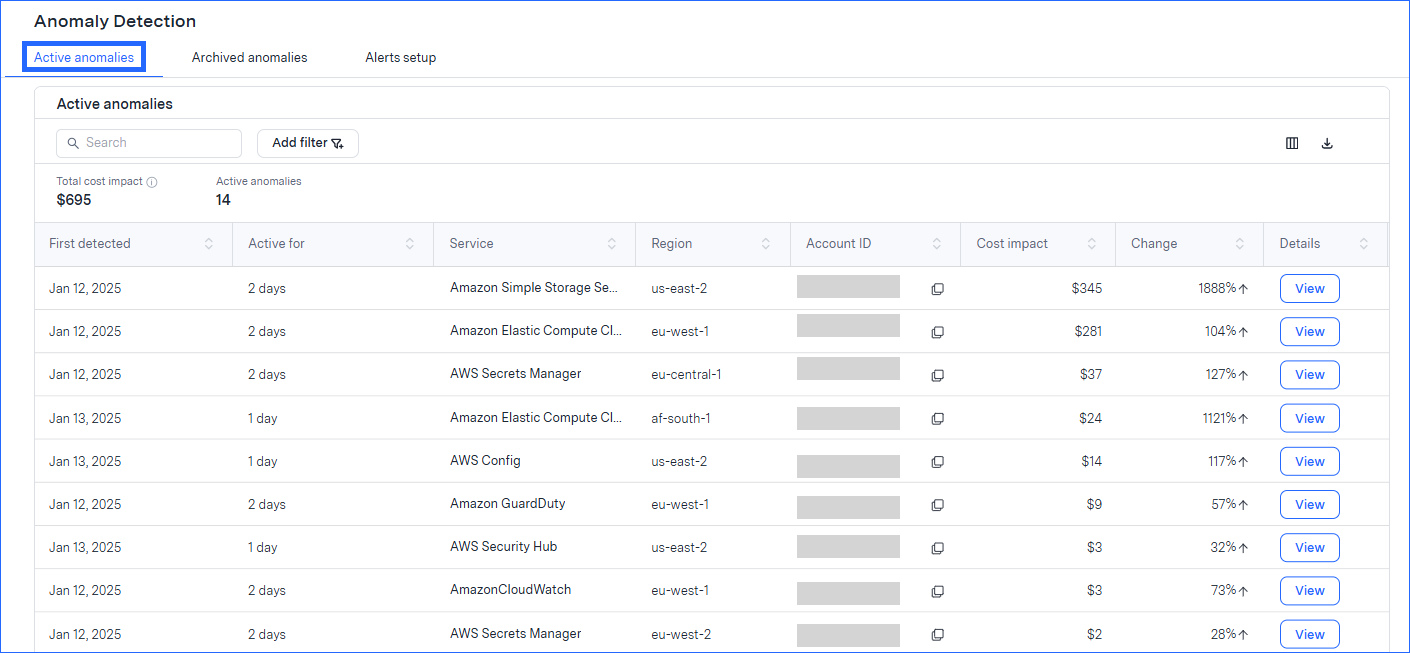
In the Active anomalies tab, you can see anomalies that are currently active, sorted by cost impact, by default. (Due to AWS delays in reporting costs in the CUR, anomaly reporting is expected to lag 2-3 days behind.)

On the Active anomalies tab, you can see:
First detected: the date when the anomaly was first detected
Active for: how many days have elapsed since the anomaly was first detected
Service, Region, and Account ID: anomalies are identified by the combination of these 3 identifiers
Cost impact: by how much spend is this anomaly out of bounds (more or less than expected), cumulatively, from when it was first detected
To see the anomaly on a graph, click View (or click anywhere) in the anomaly row:

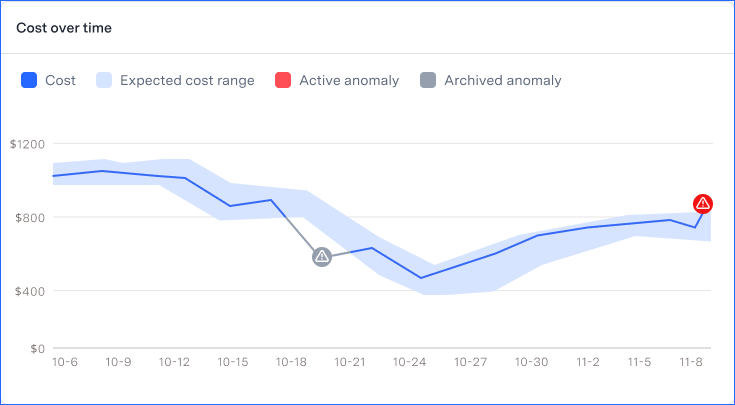
When you view an anomaly graph, you can see:
Cost: cost, based on resource use
Expected cost range: the range in which cost is expected, based on the machine learning algorithm. Cost outside of this range is an anomaly.
When data is new, there are expected to be more anomalies as the algorithm learns which spikes and dips are part of normal business.
Active date: the date when cost went out of the expected range
Archive date: the date when cost of an active anomaly returned to the expected range. When this happens, the active anomaly is archived (or closed). Archived anomalies are primarily viewed on the Archived anomalies tab. They will appear, in grey, on the Active anomalies page if the exact same Service, Region, and ID combination once again becomes an active anomaly.
You can filter this page by service, region, and account. You can also download the contents to a CSV and choose the columns that are displayed in the table.
Archived anomalies tab
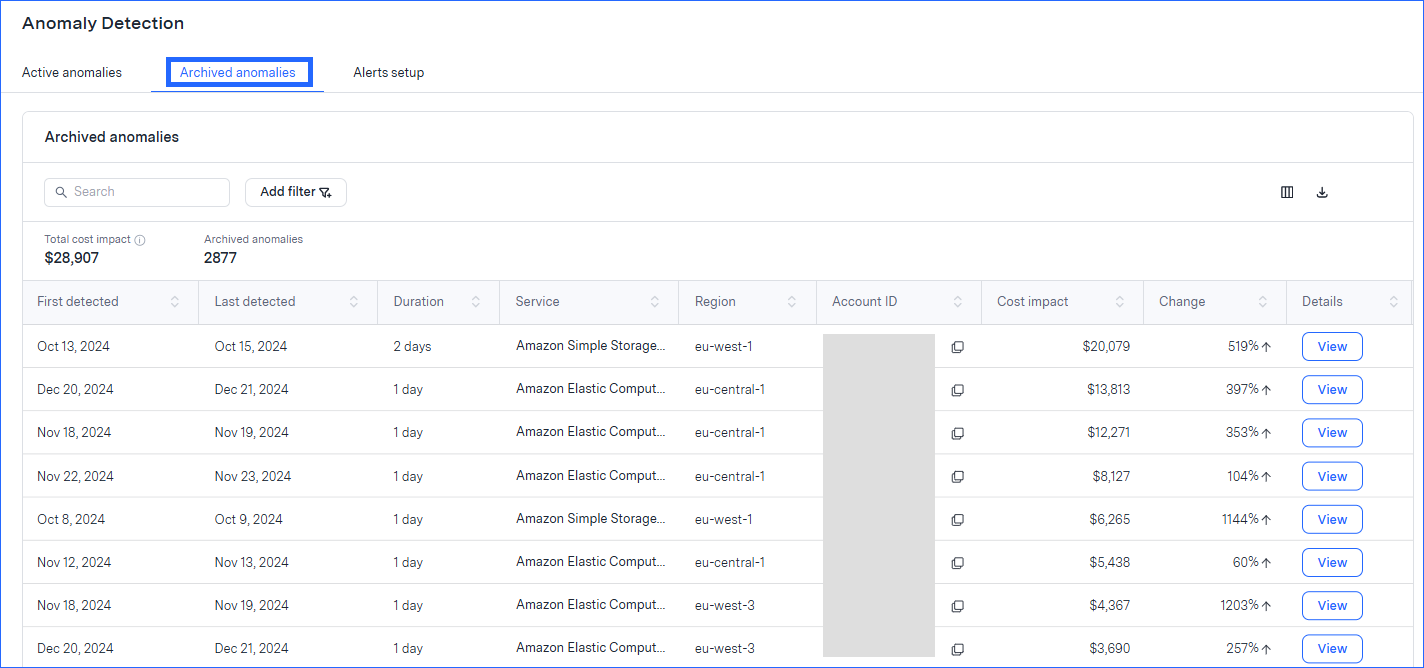
In this tab, you can view anomalies that were once active and are now archived.

Archiving happens in either of these events:
actual usage was “brought back into line” thus the cost returned within expected
the algorithm determined that the unexpected use is now the new “normal”
The graph meaning and data shown are the same as in the Active anomalies page, just that the anomalies shown here are no longer active.
Anomaly archive history is kept for 6 months.
You can filter this page by service, region, and account. You can also download the contents to a CSV and choose the columns that are displayed in the table.
Alerts setup tab
Use the Alerts setup tab to create and manage anomaly alerts.

You can create an alert can to proactively catch unusual resource activities before they escalate into larger cost issues. When creating alerts, you set a threshold that must be met in order to trigger the alert. You can define two thresholds per alert.
To create an alert:
From the Alerts setup tab, click Create an alert.
The Create an alert dialog is displayed.
In the Setup section:
Enter a name for the alert.
Select the frequency of sending the alert so long as the anomaly is active.
Enter the email addresses of up to 10 recipients, pressing Tab after each one.
In the Threshold section, define which anomalies will trigger this alert to be sent:
Select the service, region, and account that must be matched.
Set the minimum cost impact (only changes in Spend amount that meet the threshold will generate alerts). For example, “send an alert only if there is a 15% increase over the expected spend.”
Enter the amount.
Select whether that amount should be a percentage or an absolute dollar difference.
Select whether that should be an increase or a decrease.
(Optional) To add an additional threshold:
Click Add threshold.
Select whether the alert should be sent only when both threshold tests are met (“And”) or when either of the tests is met (“Or).
Define the 2nd threshold as described above.
Click Create alert.
Alerts are displayed on the Alerts setup tab.
You can edit or delete an alert.