The Zesty Disk Dashboard provides insights and analytics on your Amazon Elastic Block Store (EBS) usage, costs, and savings potential. It offers a detailed breakdown of account-specific EBS expenditures, type-based cost analysis, and over-time trends, making it easier to manage and optimize cloud storage expenses.
All the data presented is based on a CUR that was shared to the Zesty platform.
.png)
If no data is presented, no CUR data has been shared yet. To create a Zesty-compatible CUR, see Create an AWS CUR.
Dashboard sections
The following table describes the savings and cost analyses that you can make from the Zesty Disk Dashboard tab:
Section | Description | Benefit |
|---|---|---|
Potential savings | Your organization’s estimated monthly savings by using Zesty Disk’s automation capabilities. This calculation is based on disk size adjustments and reducing over-provisioning costs. Potential savings is not relevant (not shown) for current users. | By implementing these optimizations, you free up budget for other initiatives, reduce cloud waste, and ensure more efficient infrastructure use. To see how the potential savings was calculated, click Breakdown. For more information, see Savings breakdown simulator. |
Top 5 accounts’ spend | The top 5 AWS accounts by EBS spending for the selected time period. This high-level overview shows which departments or projects are consuming the most storage resources. | Identify which business units or projects are the biggest contributors to storage costs. This data allows you to take focused action, such as reallocating resources, optimizing high-cost areas, or justifying further investment in high-usage projects. |
EBS cost breakdown | The breakdown of EBS spending by different storage types. Displays the cost and percentage share for each type in numbers and in a quick visual donut chart. | The breakdown helps you prioritize high-cost storage types (like gp3) for potential savings and to review your data retention policies for snapshots. |
EBS cost over time, by account | The EBS cost trend. Track cost increases or optimizations over time by analyzing account-specific costs per month. | Understand how each account's storage needs evolve over time, and identify accounts with fluctuating or escalating costs. This lets you plan ahead for growth, control runaway storage costs, and ensure that each department’s storage spend aligns with usage expectations. |
EBS cost over time, by type | The evolution of EBS costs per storage type over time. Identify trends, such as whether certain storage types (for example, snapshots or high-IOPS disks) are becoming more expensive or being used more. | See which storage types are driving your costs and track how these costs change over time. This lets you proactively manage storage usage, transition to cheaper alternatives (for example, shifting from gp2 to gp3), or ensure that costlier types are being used appropriately. |
Savings breakdown simulator
You can see how potential savings (not shown for current users) is calculated in the savings breakdown simulator. In addition, you can change different values to forecast savings and usage scenarios.
To open the simulator, click Breakdown. .png "image(11).png")
The simulator displays how the potential savings was calculated, based on the monthly or annual selection in the Dashboard tab.
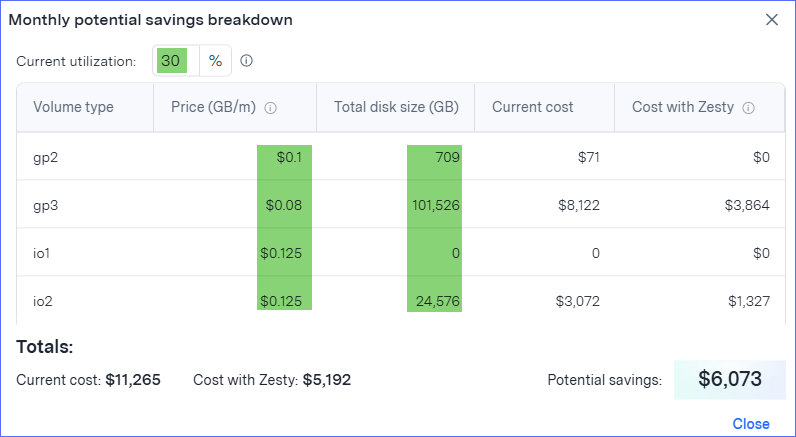
The simulator shows your current disk size per volume type, based on your CUR. The cost per volume is based on a standard cost in a specific region, so the calculated cost may differ than your actual cost. You can change these numbers to reflect your actual cost.
The Cost with Zesty value is calculated based on the expected reduction of capacity due to the utilization improvements with Zesty Disk-managed volumes. This is the total cost, including the EBS payment to AWS and the Zesty Disk fee. The cost assumes that gp2 volumes will be converted to the less expensive gp3 type.
What-if analysis
You can perform what-if analysis by changing these values (highlighted in green):
Current volume utilization is 30%, the industry average.
You can perform what-if analysis by changing the value to reflect your actual utilization.
Price is based on the list price for the US-East region.
You can perform what-if analysis by changing the value to match your actual price.
The total disk size is from the CUR.
You can change this value, for example, to forecast savings based on future capacity changes.
If you make changes in the simulator, those will be persistent so long as the Dashboard tab hasn’t been refreshed.