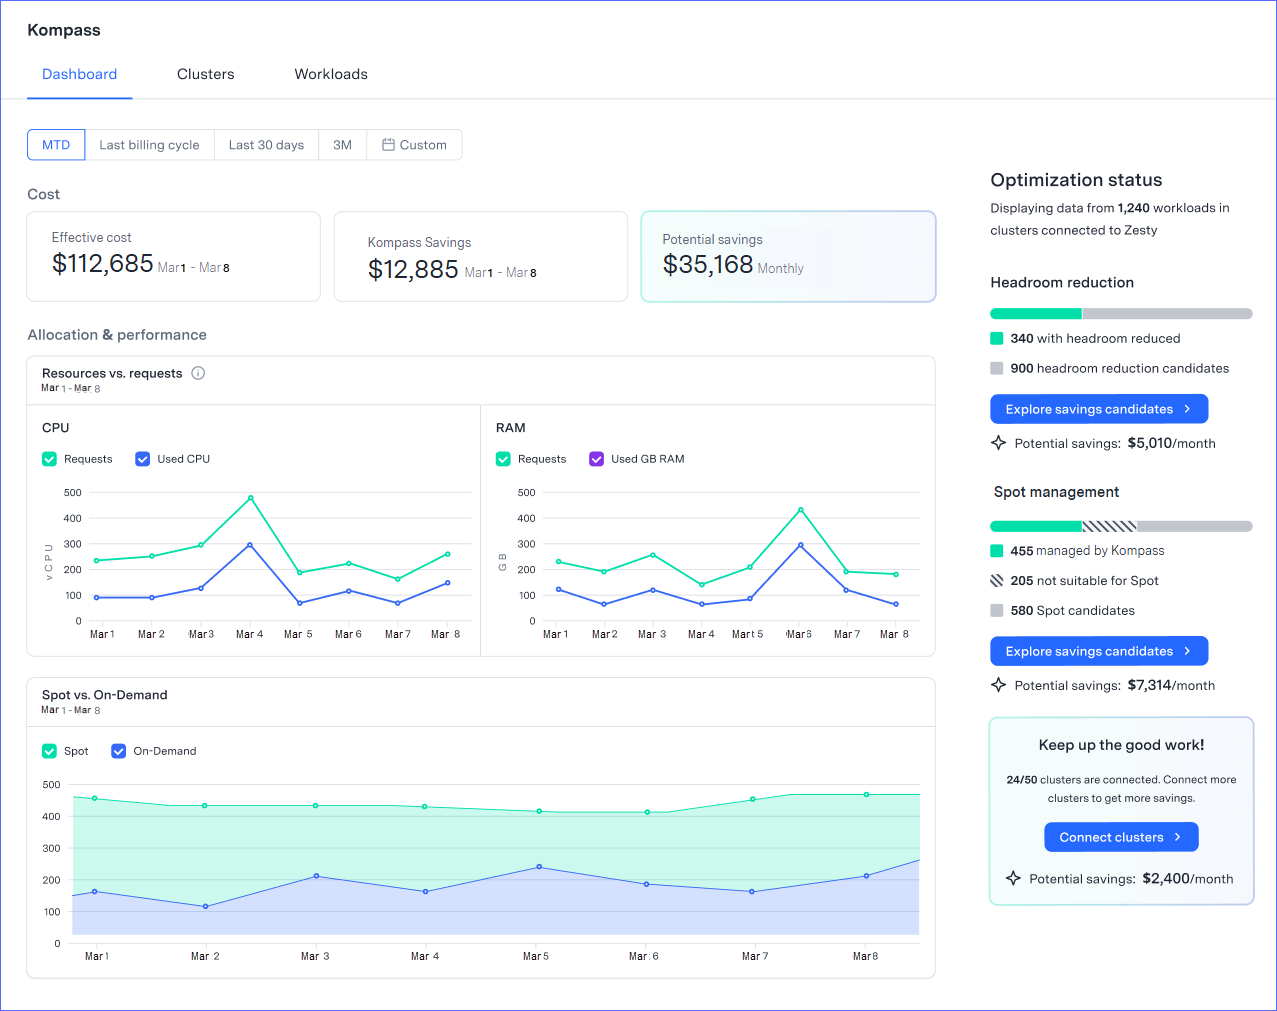
The Dashboard tab provides a single-pane-of-glass view of the metrics and optimization of your K8s clusters.

The Dashboard tab shows the following:
Cost widgets
Effective cost: actual AWS cost
Savings: savings from workloads running on Spot instances, either that Zesty manages or are self-managed
Potential savings: potential savings by activating Kompass recommendations
Cost widgets show data for all clusters in the AWS accounts that have been integrated with Zesty.
Before connecting a cluster to the Insights agent-which provides visibility to the cluster-that cluster’s data
is estimated based on AWS list price.
After you connect the agent and upload the CUR, the cluster data will be precise, as it is drawn from the exact cluster costs.
Allocation & Performance graphs
Resources vs. requests: CPU and RAM resource utilization
Spot vs. On-Demand: Workloads running on Spot vs. On-Demand instances
Optimization status section
This section shows the optimization status of all workloads in connected clusters.
For each solution, you can see:
how many workloads are optimized
how many workloads are candidates for optimization, but not yet optimized
the potential monthly savings if the optimization solutions were activated for all the candidates
If some clusters are not connected to the Insights agent, you are missing out on potential savings and visibility.
If some accounts have not been integrated, you will have no visibility to those K8s environments.
By default, data is shown for the month-to-date period. You can pick a different time frame to be displayed. (Potential savings data is always shown on a monthly basis.)
Spot management is not supported on clusters running Cluster Autoscaler. If any connected clusters are running that, a message is displayed indicating that Spot management isn’t supported on those clusters.
To see which workloads can be optimized, click ![]()
The Workloads tab is displayed showing those workloads with the Headroom reduction or Spot management recommendation that you clicked. For more information, see the Manage workloads.