On the Clusters tab you can do the following:
See an overview of cluster costs, potential savings, and Spot allocation.
For connected clusters, you can:
drill down to see cost trends and node-specific data
jump directly to the Workloads tab to see and manage optimization for all workloads on that cluster
.png)
In addition to cost and savings metrics, the Clusters table shows the agent status of each cluster. This status indicates whether the Kompass Insights agent is installed and properly working in the cluster:
Sign | Meaning |
|---|---|
Green check | Cluster is connected. |
Red exclamation point | There is an error with the cluster connection. |
Grey with horizontal line | The cluster is not connected, so the cost and savings figures are estimates. |
Blue arrows | Cluster connection is in progress. |
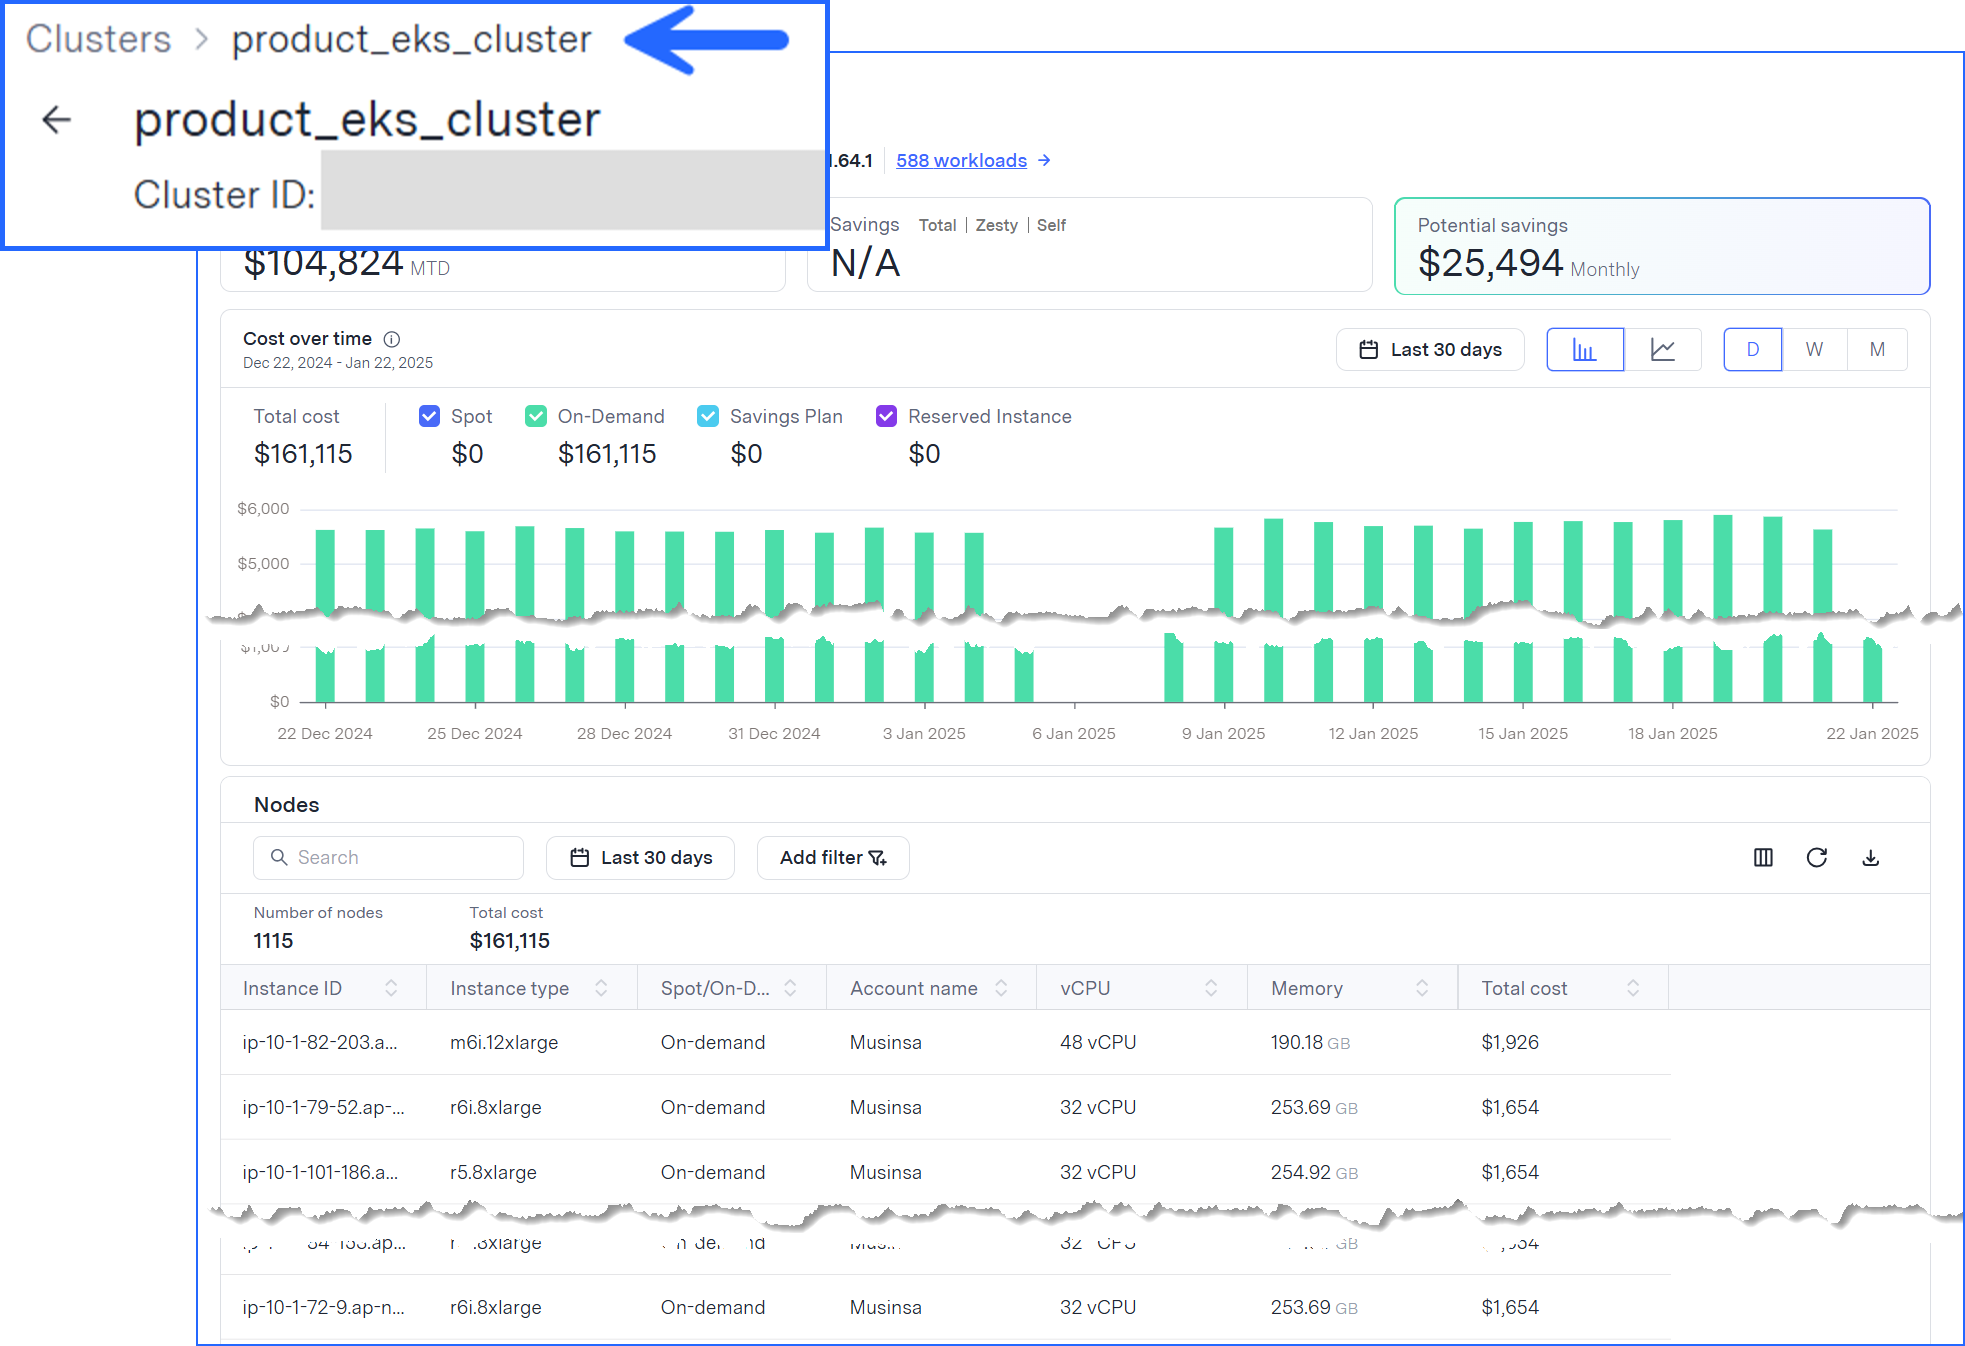
To drill down to the node details of a cluster, click anywhere in the cluster row of the table.
The drilldown view shows the cost over time for all node types in the cluster.

To see the cost for a specific node in the cluster, scroll to the Nodes section.
To see the workloads in this cluster, click the workloads link at the top of the view.
To return to the Clusters tab, click back in your browser or click Clusters in the breadcrumb.