This topic describes various ways to monitor Storage Autoscaling.
Click the link for more information about the desired monitoring method:
Monitor from the Zesty platform
Prerequisites
Access to the Zesty platform
For more information, contact Customer Support.
To monitor Zesty Disk from the Zesty platform:
Log in to the Zesty platform at https://app.zesty.co
From the main menu, select Zesty Disk.
From the Managed filesystems tab, review the filesystems that are managed by Zesty Disk, marked as
.png)
Select a filesystem and review filesystem data:
In the Metrics tab, you can see the capacity, IOPS, and throughput changes.
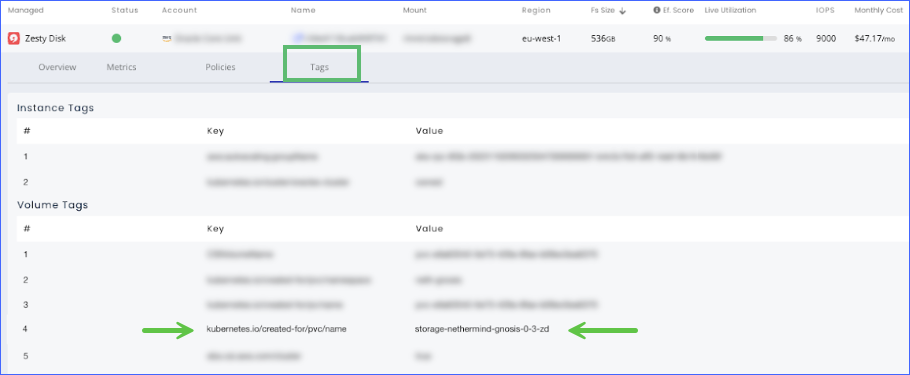
In the Tags tab, you can see instance and volume tags.
Note the
“kubernetes.io/created-for/pvc/name” tag whose value is the Zesty PVC name.
Monitor from Prometheus
To monitor using Prometheus you need to install the Storage Autoscaling with the Prometheus exporter option. Once installed, Zesty automatically adds the annotations below to the Zesty Storage Agent so it can be discovered by Prometheus.
For more details, see Deploy Storage Autoscaling.
prometheus.io/port=<PORT_FROM_HELM_VALUES>
prometheus.io/scrape=true
Available queries
You can query the following utilization parameters:
Total PVC capacity
label_replace(sum(kubelet_volume_stats_capacity_bytes) / 1024 / 1024 / 1024, "metric", "Total PVC's capacity", "", "")Total PVC used size
label_replace(sum(kubelet_volume_stats_used_bytes) / 1024 / 1024 / 1024, "metric", "Total PVC's used size", "", "")PVC average utilization
label_replace(avg(kubelet_volume_stats_used_bytes / kubelet_volume_stats_capacity_bytes) * 100, "metric", "PVC's avg utilization", "", "")Amount of PVs in cluster
label_replace(count(kube_persistentvolume_info{csi_driver="ebs.csi.aws.com", job="kubernetes-services"}), "metric", "Amount of PVs in cluster", "", ""Amount of StatefulSet PVs in cluster
label_replace(count(kube_persistentvolume_info{csi_driver="ebs.csi.aws.com", job="kubernetes-services"}), "metric", "Amount of Statefulset PV's in cluster", "", "")Average PV size
label_replace(avg(kubelet_volume_stats_capacity_bytes) / 1024 / 1024 / 1024, "metric", "Average PV Size", "", "")Amount of StatefulSets PVCs in cluster
label_replace(count(kube_statefulset_persistentvolumeclaim_retention_policy{job="kubernetes-services"}), "metric", "Amount of StatefulSets in cluster", "", "")Amount of PVCs in cluster
label_replace(count(kube_persistentvolumeclaim_info{csi_driver="ebs.csi.aws.com", job="kubernetes-services"}), "metric", "Amount of PVCs in cluster", "", "")
Monitor from Grafana
Zesty provides a custom Grafana dashboard that shows Storage Autoscaling PVCs metrics.
To import the dashboard to your Grafana, use the following link: https://static.zesty.co/ZestyDiskPVC/zesty-pvc-grafana-dashboard.json
Monitor with the Kubectl plugin
You can use the Kubectl plugin to generate a CSV with relevant workload and storage information for a Kubernetes cluster.
The CSV provides insights into workload types, storage capacities, your storage footprint and more. The CSV includes information about the workload name and type, the Pod name, PV name and size, usage, and utilization.
The CSV output is sorted by PV size (descending). Storage Autoscaling PVs are not included.
To install Krew, see Windows or MacOS.
To use the plugin, you need to install it first.
Prerequisites
Kubectl is installed
To install the Zesty Kubectl plugin:
Add the Zesty repository to Krew index:
kubectl krew index add zestyIndex https://github.com/zesty-co/kubectl-plugin.gitVerify the repo was added successfully:
kubectl krew index listInstall the plugin:
kubectl krew install zestyIndex/zestyVerify that the plugin was installed successfully:
kubectl krew listValidate the Kubectl context:
kubectl config current-contextThe current cluster’s name will be displayed.
To use the kubectl plugin:
The following table describes the plugin commands to export information about cluster PVs to a CSV:
To export this | Run this command | Example |
|---|---|---|
For PVs in all namespaces, with the default output location |
|
|
For PVs in a specific namespace |
|
|
To specify an output path |
|
|
For PVs in a specific namespace and output path |
|
|
Additional filters |
|
|