The top line of data shows aggregate figures for all clusters in integrated accounts.
The Insights agent
Before the Insights agent is installed, all cost and savings data shown are estimated based on AWS list price.
You can see the following data, per cluster in the cluster data table:
Data | Description | Comments |
|---|---|---|
Name | The cluster name. | |
Workloads with recommendations | The amount of workloads on this cluster with Kompass optimization recommendations. | Only shown when the Insights agent is installed in the cluster. |
Managed workloads | The amount of workloads on this cluster that Kompass is currently optimizing. | To see these workloads, click view. |
Account | The account this cluster is part of. | |
CPU utilization | The percentage of CPU used vs. available. | Only shown when the Insights agent is installed in the cluster. |
Cost | The cost to run this cluster (last 30 days). | Before the Insights agent is installed, this amount is estimated. |
Savings | The cost that has been saved with Kompass optimization (last 30 days). | |
Potential savings | The amount you could have saved if Kompass solutions were applied to the workloads on this cluster (last 30 days). | Before the Insights agent is installed, this amount is estimated. |
Solutions | The Kompass solutions that are installed and enabled on this cluster. | The solution status is indicated by the color of its name:
|
Action | Install an agent. | To install and enable Kompass solutions, click Connect. |
Cost, savings, and potential savings figures are for the last 30 days.
Additional table activities:
Show relevant data:
Search by name or add filter criteria.
The data in the table is from the default columns. To see and select other data columns, click the column picker
 .
.Sort the table by a column.
Show more rows per table page and change the page shown.
You can export the data in the table.
You can refresh the table.
This is useful when there have been recent changes that are not yet reflected in the table.
To drill down to the node details of a cluster, click anywhere in the cluster row of the table.
The drilldown view shows the cost over time for all node types in the cluster.
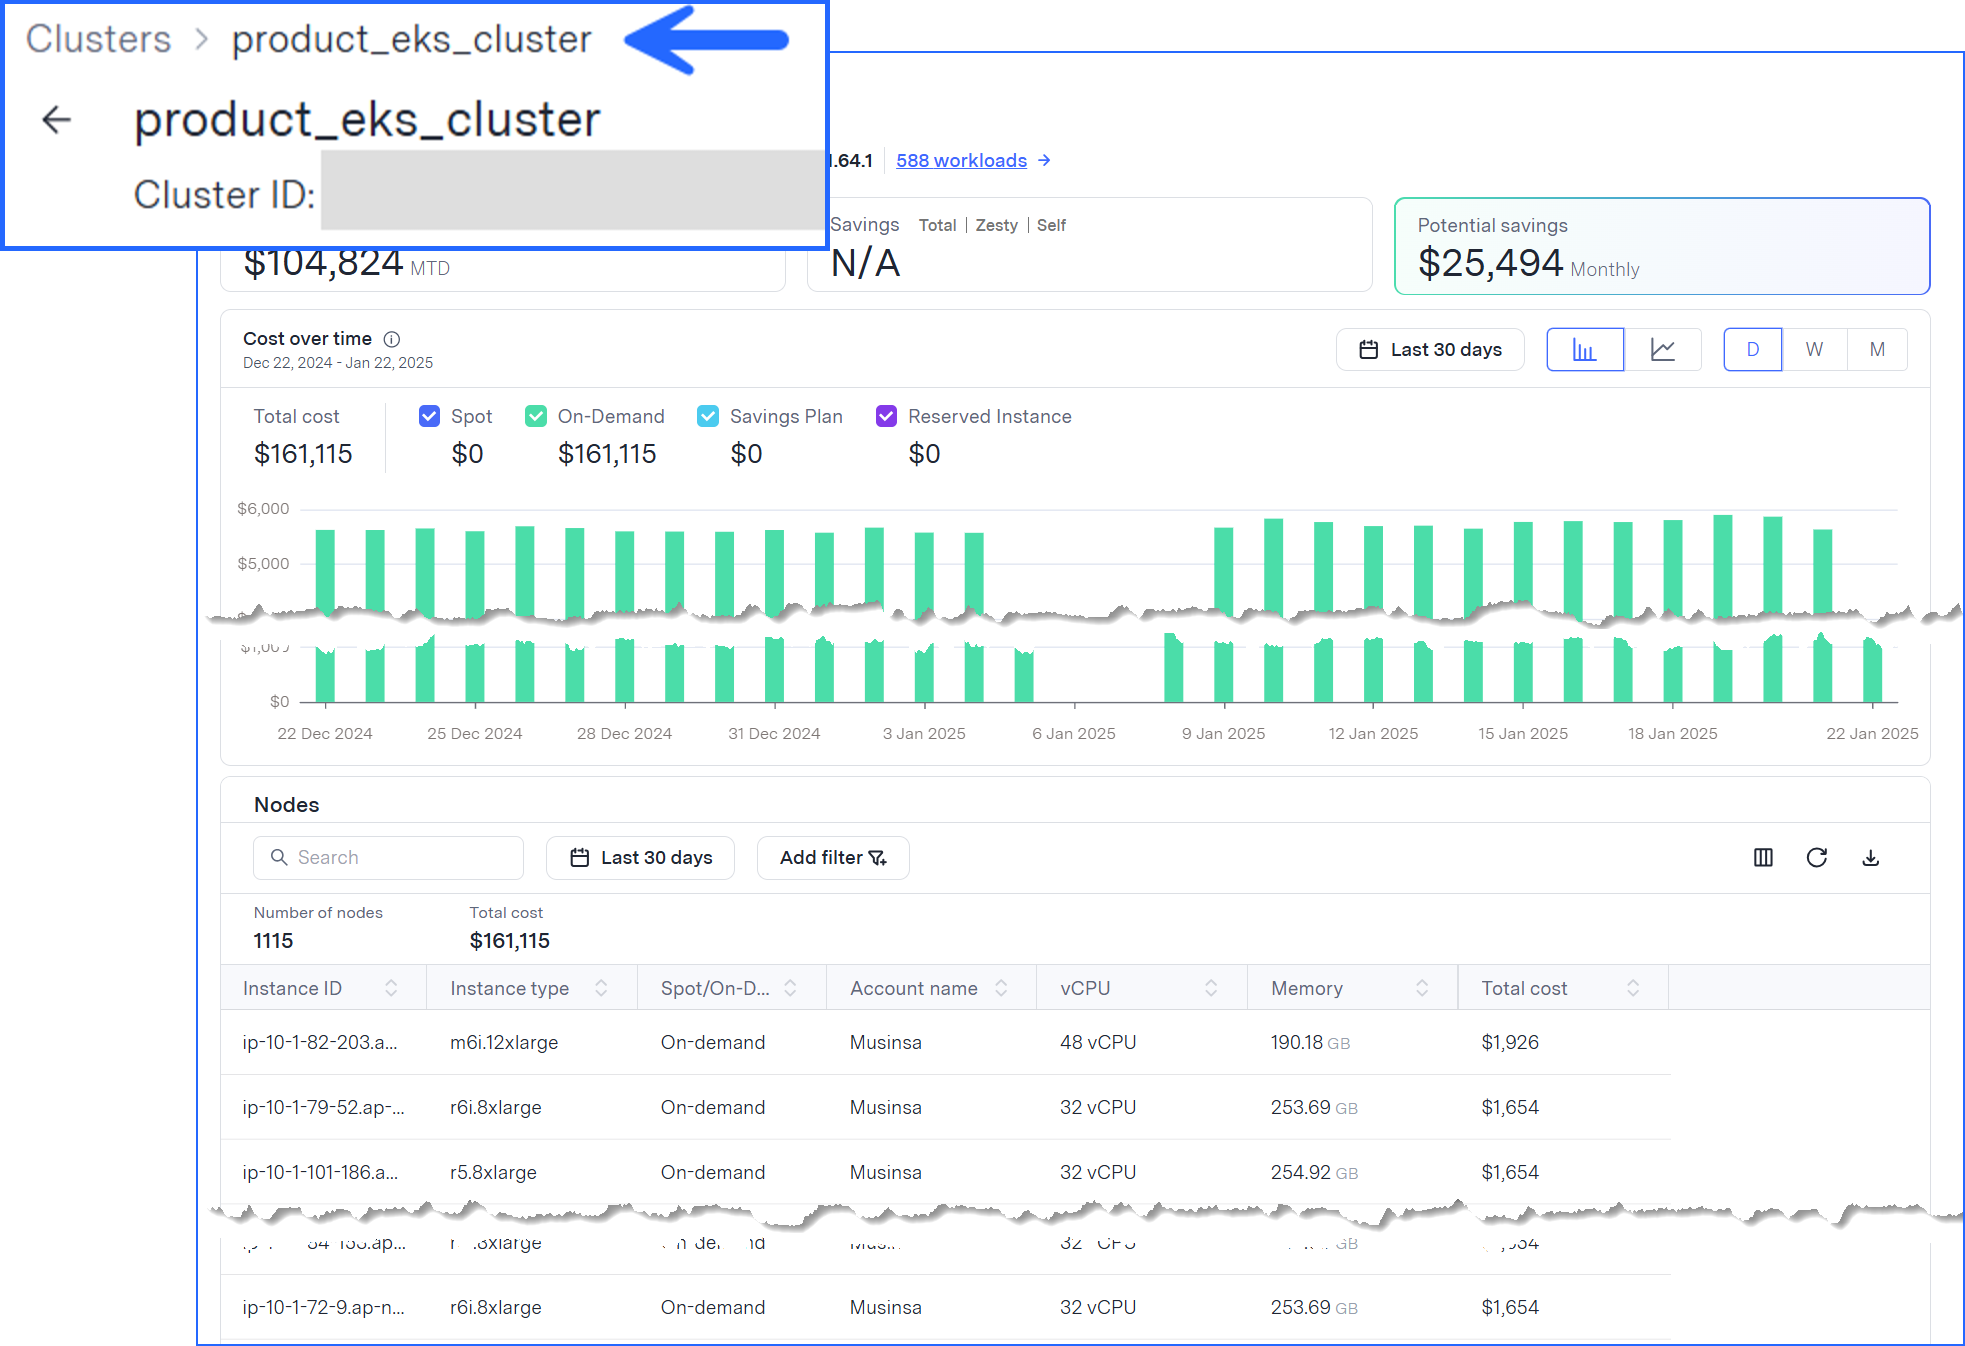
To see the cost for a specific node in the cluster, scroll to the Nodes section.
To see the workloads in this cluster, click the workloads link at the top of the view.
To return to the Clusters tab, click back in your browser or click Clusters in the breadcrumb.