Use the Clusters tab to manage your clusters.
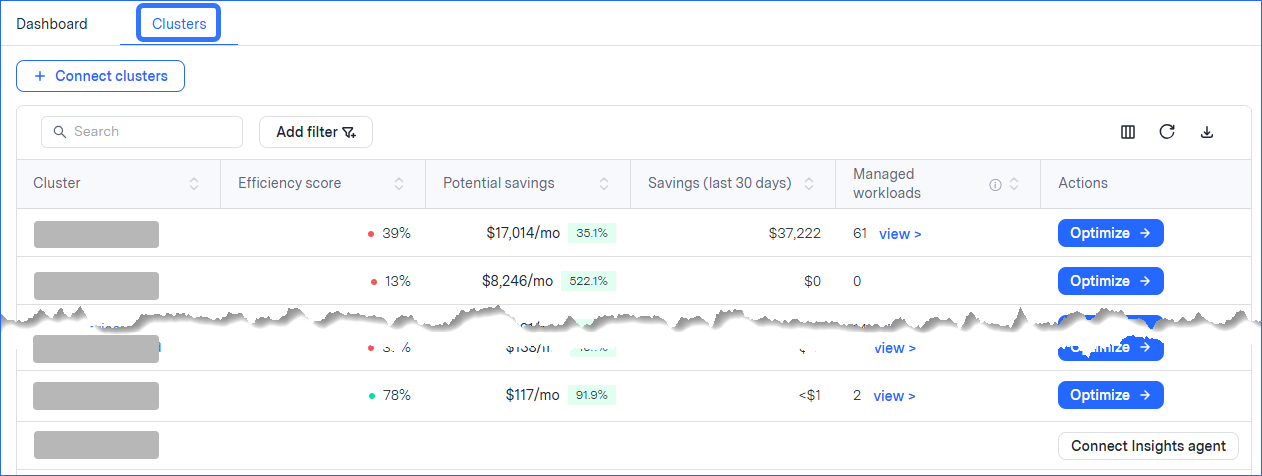
To open the Clusters tab, choose Kompass > Clusters.
The Clusters tab shows data for all clusters in your environment. You can also see additional data for specific clusters by drilling down on a cluster.
In the specific-cluster view, you can filter to show data only for selected node pools (for clusters that use Karpenter to provision nodes). This helps you better understand the infrastructure savings and evaluate CPU/RAM allocation and efficiency within that scope.
All data shown is for clusters running under accounts that are onboarded to Zesty, sorted by highest potential savings (by default). In Azure, only connected clusters are shown.
Use the Clusters tab to do the following:
See data for all clusters
You can see the following cluster data:
Agent status: The status of the Insights agent on this cluster: Connected or Not connected
Cluster name: The name of the cluster
Efficiency: How efficient the cluster is, that is how much compute spending is being wasted
Potential savings: The projected savings after applying Kubernetes optimization solutions (for next 30 days, also expressed as a percentage of the total cost of the last billing cycle)
Past savings: The cost that was saved by applying Kubernetes optimization solutions (last 30 days)
Managed workloads: The amount of workloads on this cluster with an active Kubernetes optimization solution. To see these workloads, click view. The Workloads tab opens with only those workloads displayed. For more information, see Manage workloads.
The fields above are shown by default. You can use the field picker to add the following cluster fields to the table: Cloud provider, Account, Account ID, Region, CPU utilization, RAM utilization, Cost, Savings, Autoscaler type, Nodes, CPU, Memory, Storage, GPU, Agent version, and Version. For more information about the field picker, see Additional table activities.No cluster data?
If only the cluster name is shown, the cluster is not connected to the Insights agent. To gain cluster visibility, and determine whether it is optimized, connect it to the Insights agent.
See data for a specific cluster
You can drill down to see the efficiency, resources, and cost details of a specific cluster.
To see the detail, click anywhere in the cluster row of the table to open that cluster’s Cluster > Overview tab.
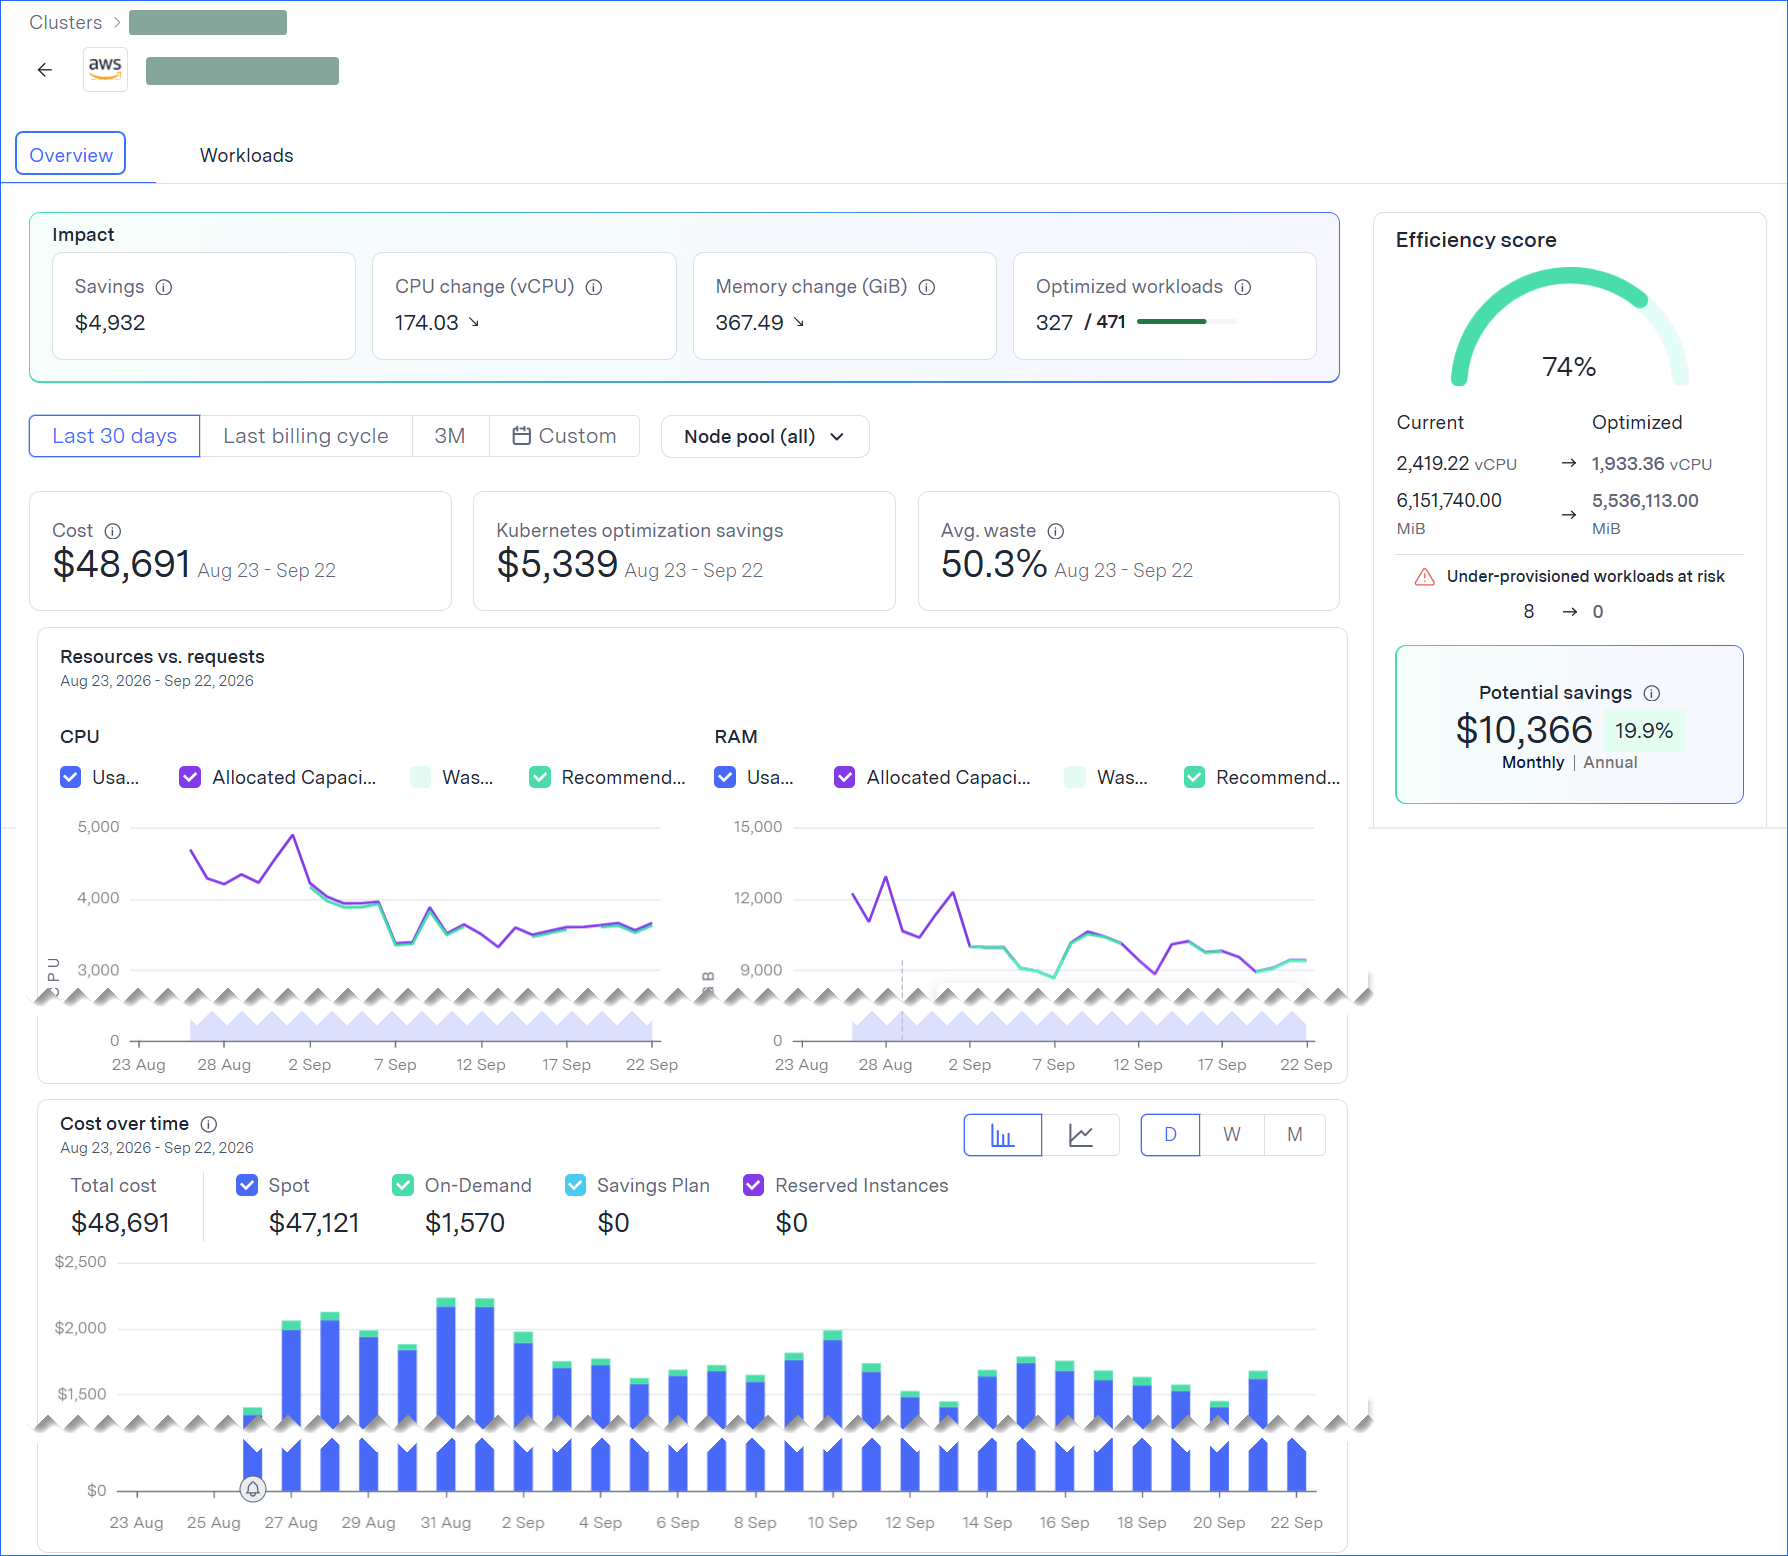
The data shown are almost the same that are shown on the Dashboard tab, but for only the cluster you selected.
The graphs in the drilldown show the following for CPU and RAM:
Usage: The amount of the resource currently used by Pods.
Allocated capacity: The total allocatable capacity of the nodes, excluding system-reserved capacity
Waste: The difference between allocated capacity and recommended capacity.
Recommended capacity: The total capacity recommended for Pods based on their resource requests.
No savings and waste data?
To view Savings, Waste, and Allocated capacity data, clear the Node pool filter and select the full cluster.
The Overview tab is only available if the cluster is connected to the Insights agent.
To return to the Clusters tab, move back in your browser or click Clusters in the breadcrumb.
Connect cluster to the Insights agent
To connect a specific cluster, click Connect Insights agent on that cluster row, or connect multiple clusters by clicking Connect clusters. For more information, see Deploy Kubernetes resource optimization solutions.
Optimize workloads in the cluster
If the Optimize button is displayed, click it to open the Opportunities view on the Clusters > Workloads tab so you can see the workloads that can be optimized.
For more information, see Manage workloads.
Data is refreshed hourly. A refresh indicator appears at the top of each page before updates are applied, and updated values are highlighted in blue.
Additional table activities
Show relevant data:
Search by name or add filter criteria.
The data in the table is from the default columns.
To see and select other data columns, click the column picker .
.Sort the table by a column.
Show more rows per table page and change the page shown.
You can export the data in the table.
You can refresh the table.
This is useful when there have been recent changes that are not yet reflected in the table.