Use the Clusters > Workloads tab to manage workloads in a cluster.
To open the Workloads tab, select the Workloads tab from the Clusters > Overview tab.
(Alternatively, click Optimize from a workload row in the Clusters tab.)
The Workloads tab contains two views:
The Opportunities view shows workloads that currently have recommendations or have an inactive solution.
Use this view to review potential savings and compare current CPU, memory, and minimum replica values with the recommended values.
The Active view shows currently managed workloads.
Use this view to review savings, active solutions, and the CPU and memory impact of optimization.
Do you see this banner?
If this banner is shown, Adaptive Pod placement (APP) is not enabled on the cluster. You can reduce cluster costs - beyond the savings in the table - by enabling APP on the cluster.
For more information, see Enable Adaptive Pod placement.

Use the Workloads tab to do the following:
View potential savings and optimization data
View the impact of active optimizations
Work with the workloads table
Optimize workloads
Manage optimized workloads
View potential savings and optimization data
From the Clusters > Workloads tab, select Opportunities to view workloads that currently have recommendations or whose solution status is inactive.
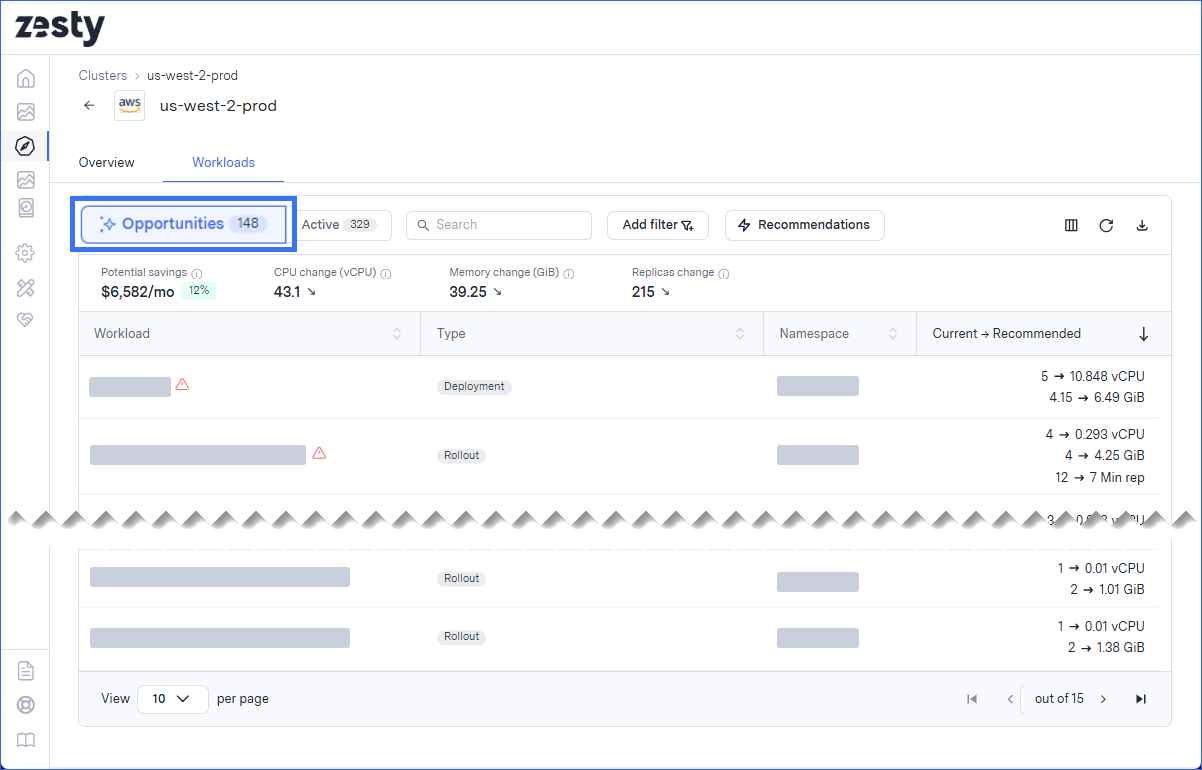
The summary above the table shows combined data for the workloads in the Opportunities view:
Potential savings: the 30-day projected savings after applying optimization solutions (also expressed as a percentage of the total cost of the last billing cycle)
Potential savings per solution
If you filter this tab for a specific solution, the potential savings reflects savings from that solution only. Potential savings from APP is not included, even when the Solution filter is applied.
CPU change (vCPU): the difference between the total current CPU requests and the total recommended CPU requests for workloads with recommendations
Memory change (GiB): the difference between the total current memory requests and the total recommended memory requests for workloads with recommendations
Replicas change: the difference between the current total minimum number of replicas and the recommended total minimum number of replicas for workloads with recommendations
A down arrow indicates a decrease. An up arrow indicates an increase.
You can see the following data for every relevant workload - active workloads or those with at least one Pod running in the last 5 days - in the cluster:
Workload general data: The workload name, namespace, and type.
Under-provisioned workload?
If a workload CPU or RAM is under-provisioned,
 is displayed. Hover to see the issue.
Current → Recommended: The following current and recommended values:
The current vCPU request that is configured for each workload replica compared to the value after applying the recommended optimization.
The current memory request configured for each workload replica compared to the value after applying the recommended optimization.
The current minimum number of replicas configured for the workload compared to the value after applying the recommended optimization.
No recommendations for this workload?
The Current → Recommended fields will appear blank if there are no available optimization suggestions.
By default, the table sorts workloads by the largest difference between the current and recommended vCPU requests. If a vCPU recommendation is not available, it sorts by the memory difference.
View the impact of active optimizations
From the Clusters > Workloads tab, select Active to view currently managed workloads.
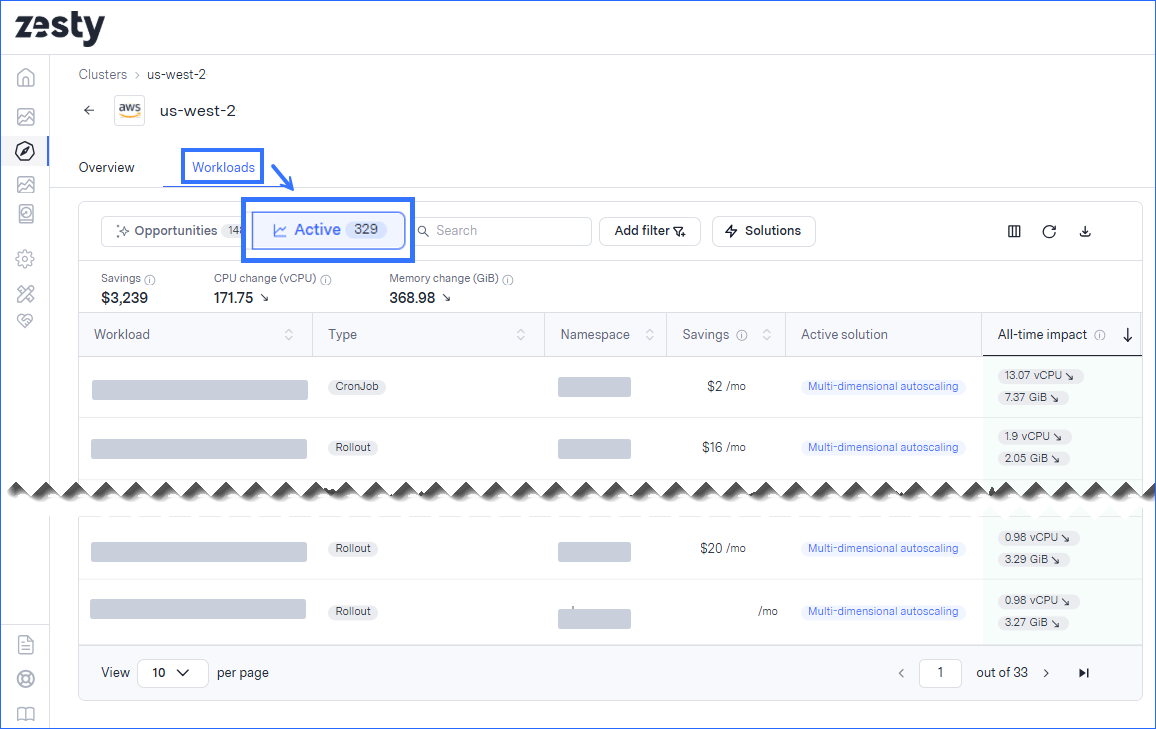
The summary above the table shows combined data for the workloads in the Active view:
Savings: the total savings from active optimizations
CPU change (vCPU): the average vCPU change since the optimization was first applied
Memory change (GiB): the average memory change since the optimization was first applied
The table shows the following fields, by default:
Workload general data: the workload name, type, and namespace
Savings: the savings for the workload since optimization was first applied
Active solution: the solution that is currently active on the workload
Changes are displayed immediately. Errors are displayed in red.
All-time impact: the average vCPU and memory change since optimization was first applied
By default, the table sorts workloads by the largest difference between the original and optimized vCPU requests. If there is no vCPU difference, it sorts by the memory difference
Work with the workloads table
The data described for the Opportunities and Active views are shown by default.
You can use the field picker to add the following workload fields to the table: Cloud provider, CPU utilization, PDB, HPA type. For more information about the field picker, see Additional table activities.
Eviction status: The Zesty classification of the workload for Adaptive Pod placement savings. You can use the status to identify which Pods you can reconfigure or restart to accelerate APP savings. For more information, see Adaptive Pod placement.
To view this data, use the column picker to add it to your table.
Evictable: all Pods in the workload can be safely evicted
Unevictable: all Pods in the workload cannot be safely evicted
Hybrid: the workload contains a mix of evictable and unevictable Pods
Unknown: the status of at least one Pod cannot be determined.
Eviction status not showing?
After you activate Adaptive Pod placement in the values.yaml file, it takes one hour for the status to populate. During this time, the status of all workloads displays as Unknown. For more information, see Enable Adaptive Pod placement.
Click here for viewing tips for easier workload management
In addition to the standard filter options, use these filtering options to work smarter and faster:
To see this
Filter this way
All workloads that are either currently optimized by a specific solution OR have optimization recommendations for the specific solution
Click Solution and select the specific solution.
The columns related to other solutions are removed.
Only workloads that can be optimized
(the workload has recommendations and no active solutions)
Turn on the Recommendations only toggle.
Only workloads related to a specific solution that can be optimized
(this combines the previous options)
Click Solution and select the solution, and also turn on the Recommendations only toggle.
Only workloads at risk (under-provisioned)
Click Add filter and select Workloads at risk.
Only workloads with an active optimization
Click Add filter, then select Status and Active.
Additional table activities
Show relevant data:
Search by name or add filter criteria.
The data in the table is from the default columns.
To see and select other data columns, click the column picker .
.Sort the table by a column.
Show more rows per table page and change the page shown.
You can export the data in the table.
You can refresh the table.
This is useful when there have been recent changes that are not yet reflected in the table.
Optimize workloads
To apply an optimization to a workload from the user interface, do this:
Click anywhere in the workload row.
The workload drawer opens where you can apply the optimization.
Select the Multi-dimensional autoscaling tab.
Turn on capabilities and select policies.
Click Apply to workload.
For more information, see Apply MDA optimization with the UI.
To optimize workloads with YAML, see Apply MDA optimization with YAML.
Manage optimized workloads
If a workload has an active solution, you can change the selected policy or remove the solution from the workload.
To change a currently active optimization from the user interface, click anywhere in the workload row. The workload drawer opens where you can change the optimization. For more information, see Apply MDA optimization with the UI.
To change a currently active optimization with YAML, see Apply MDA optimization with YAML.