Use the Dashboard tab for a single-pane-of-glass view of the metrics and optimization of your K8s environment.
With information on the currently running resources and costs, you can determine:
The impact that Kubernetes resource optimization has made on your organization
The impact section provides clear, quantifiable visibility into what actually happened to your infrastructure after activating Pod rightsizing or MDA.
How efficient your environment is - and how much you could save - by applying Kubernetes resource optimization recommendations
The efficiency score measures how efficiently CPU, memory, and replicas are allocated, based on Kompass recommendations. Potential savings shows how much you can save by further optimizing these resources.
For a deeper dive into the efficiency score, click here.
Included: Workloads with an active or recommended Pod rightsizing or Headroom reduction solution.
Excluded: Workloads with no recommendations.
The score is recalculated whenever a new recommendation is generated or a solution is applied to a workload.
Which workloads are under-provisioned
Efficiency doesn’t mean reducing all resources to the bare minimum, not when OOM and CPU throttling can hurt your business. Kubernetes resource optimization helps you protect your SLA by adding necessary resources to under-provisioned workloads at risk.
The efficiency score takes both potential resource reductions and also resource additions (in the case of under-provisioned workloads) into account.
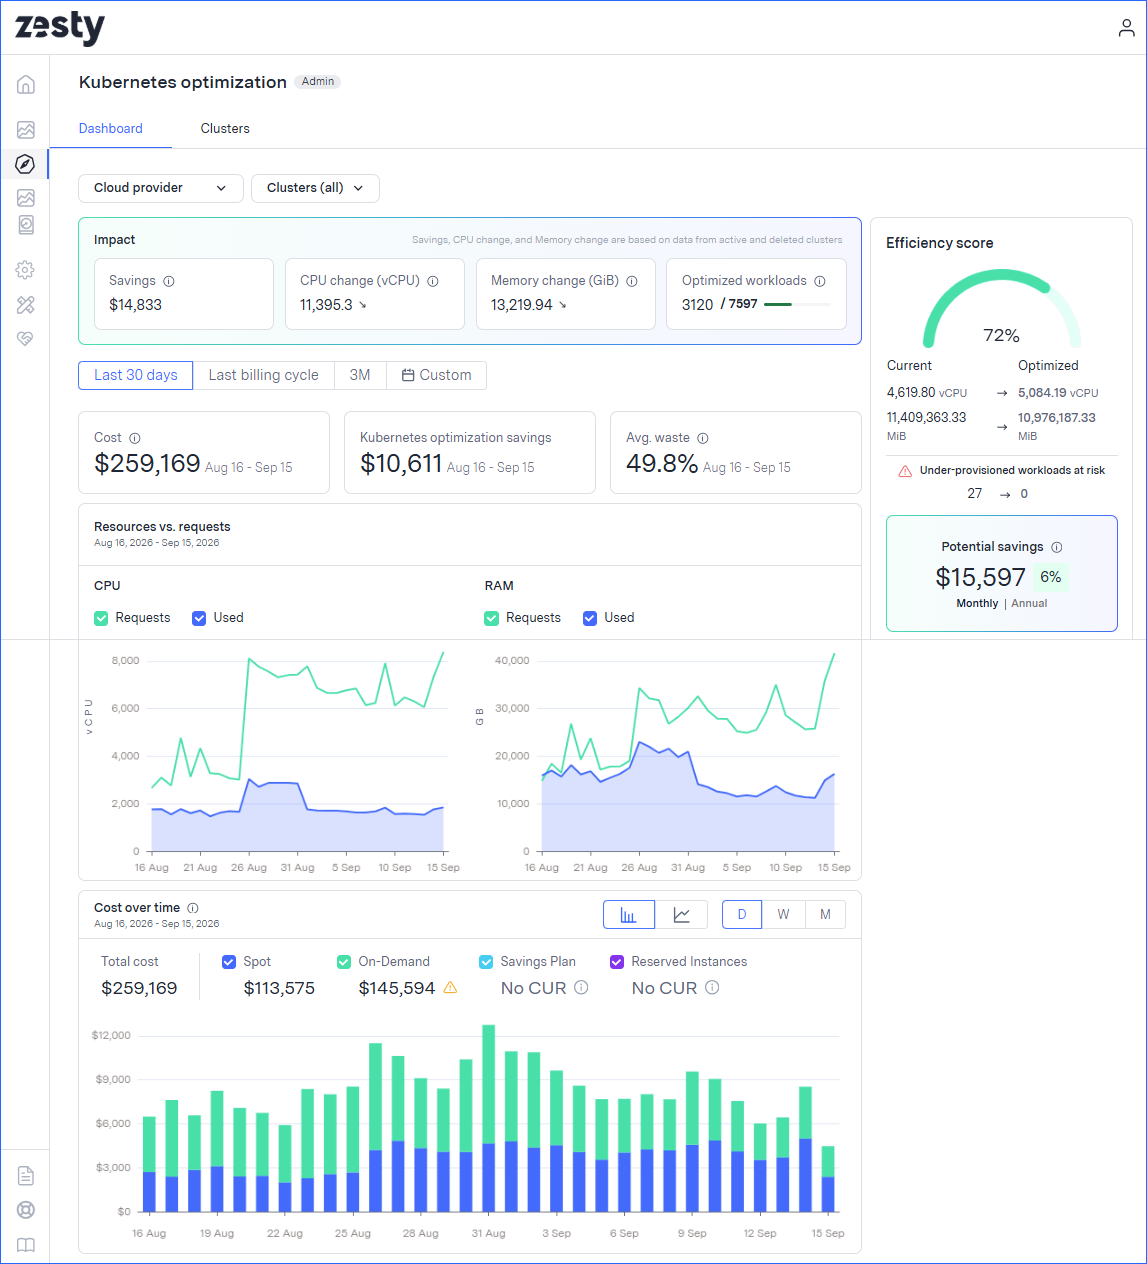
Use the Dashboard tab to:
See the impact that Kubernetes resource optimization has made in your environment.
See historical environment data and the current efficiency score.
Optimize workloads from all connected clusters in your environment.
The dashboard shows data for all clusters that are connected to the Insights agent, with current resource requests, in integrated accounts. You can filter the view to see data for selected clusters.
Data is refreshed hourly. A refresh indicator appears at the top of each page before updates are applied.
See impact
The impact section links resource adjustments directly to all-time monetary savings and workload availability, and shows the ongoing value of Kubernetes optimization.
Savings: Displays the cumulative, all-time monetary savings generated across managed workloads.
CPU change (vCPU): Displays the net average vCPU change (in cores) since activation, accompanied by a directional arrow.
Memory change (GiB): Displays the net average RAM change (in GiB) since activation, accompanied by a directional arrow.
Optimized workloads: Displays a ratio representing the number of actively optimized workloads out of the total workload count across the selected clusters.
See environment data
If you have shared CUR data, the cost and savings data will be precise, as it is drawn from the exact cluster costs. Otherwise, it’s estimated based on list price.
By default, cost and savings data is shown for the last 30 days. You can pick a different time frame to be displayed. (Potential savings data is always shown for the next 30 days.)
Environment data is shown for the selected clusters (all clusters, by default).
Cost and savings data
Cost: actual AWS cost
Kompass savings: actual savings from all workloads with active Kubernetes resource optimization solutions
Average waste: the average percent of wasted node capacity (total node capacity less the requested and used capacity), over all nodes
Don’t see the average waste?
To see the average waste figure, the installed Insights agent must be v0.164.1 or later. In earlier versions, N/A is displayed.
Potential savings: 30-day projected savings after applying Kubernetes resource optimization solutions and reducing node waste (also expressed as a percentage of the total cost of the last 30 days)
Potential savings is shown under the Efficiency score.
Allocation and cost graphs
Resources vs. requests: CPU and RAM resource utilization
Cost over time: breakdown of the displayed cost
Efficiency
Efficiency score: how optimized are the workloads in your environment
Request levels: shows the current, versus Kubernetes resource optimization-optimized, levels of vCPU, GiB, and replicas for all workloads that can be optimized
Workloads at risk: how many workloads are currently under-provisioned
Potential savings: 30-day projected savings after applying Kubernetes resource optimization solutions and reducing node waste (also expressed as a percentage of the total cost of the last 30 days)
Optimize workloads
To optimize workloads with the user interface, click Optimize resources. This opens the Clusters tab from where you can optimize workloads. For more information, see Manage clusters.
The dashboard shows data for all clusters that are connected to the Insights agent, with current resource requests, in integrated AWS accounts.
If you have shared CUR data, the cost and savings data will be precise, as it is drawn from the exact cluster costs. Otherwise, it’s estimated based on list price.
By default, data is shown for the last billing cycle. You can pick a different time frame to be displayed. (Potential savings data is always shown for the next 30 days.)